Portfolio Performance: Unique Opportunities
As of 12/31/24Value of $100,000 invested on 3/31/99
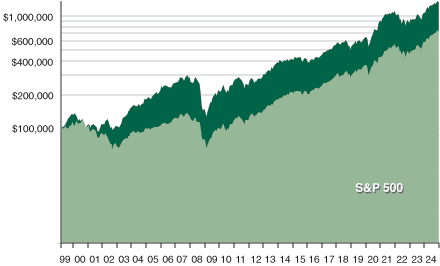
[Log Scale]
| Date | Unique Opps | S&P 500 | Difference |
|---|---|---|---|
| 12/31/1999 | $133,809 | $115,241 | $18,568 |
| 12/31/2000 | $106,415 | $104,721 | $1,694 |
| 12/31/2001 | $108,167 | $92,325 | $15,842 |
| 12/31/2002 | $105,850 | $71,950 | $33,900 |
| 12/31/2003 | $151,536 | $92,707 | $58,829 |
| 12/31/2004 | $182,795 | $102,836 | $79,959 |
| 12/31/2005 | $217,211 | $108,005 | $109,206 |
| 12/31/2006 | $253,342 | $125,059 | $128,283 |
| 12/31/2007 | $282,721 | $131,886 | $150,835 |
| 12/31/2008 | $148,109 | $81,961 | $66,148 |
| 12/31/2009 | $215,922 | $103,615 | $112,307 |
| 12/31/2010 | $257,577 | $119,215 | $138,361 |
| 12/31/2011 | $242,518 | $121,690 | $120,828 |
| 12/31/2012 | $283,154 | $141,240 | $141,914 |
| 12/31/2013 | $385,876 | $186,853 | $199,023 |
| 12/31/2014 | $406,183 | $212,452 | $193,731 |
| 12/31/2015 | $411,439 | $215,426 | $196,013 |
| 12/31/2016 | $445,213 | $241,203 | $204,010 |
| 12/31/2017 | $547,081 | $293,891 | $253,190 |
| 12/31/2018 | $486,517 | $281,007 | $205,510 |
| 12/31/2019 | $637,444 | $369,533 | $267,910 |
| 12/31/2020 | $883,444 | $437,535 | $445,909 |
| 12/31/2021 | $1,080,620 | $563,195 | $517,425 |
| 12/31/2022 | $850,694 | $461,294 | $389,400 |
| 12/31/2023 | $1,045,101 | $582,482 | $462,620 |
| 12/31/2024 | $1,287,295 | $728,095 | $559,200 |